Human-centered interfaces from an interface-centered human:
Busy Bee
Measuring digital productivity and human movement in a creative studio with a new tool for spatial analysis and data visualization.
CHALLENGE
Use new technologies and tools to measure and visualize the relationship between movement and productvity in a studio environment.
PROJECT
Busy Bee, a system that uses physical computation, environmental sensors, computer vision and scripts to track circulation and digital file creation over time — and provides an interface for interactive exploration of the data.
DETAILS
Columbia Graduate School of Architecture, Planning and Preservation (GSAPP)
Measure
AFTER
Columbia Graduate School of Architecture, Planning and Preservation (GSAPP)
Measure
Lorenzo Villaggi and Carlo Bailey, instructors
Alex Rosenthal, Tao Yu and Zhiwen Zhang, team members
Spring 2016
Spring 2016
AFTER
Published in Columbia GSAPP’s Abstract 2016.
︎
The system monitors circulation, digital productivity and ambient environmental factors in one studio of Avery Hall, and visualizes this data to enable new design interventions. A step toward the Internet of Things, Busy Bee represents one part of a broader feedback loop, where architecture and the space it defines share a dynamic and reciprocal relationship.
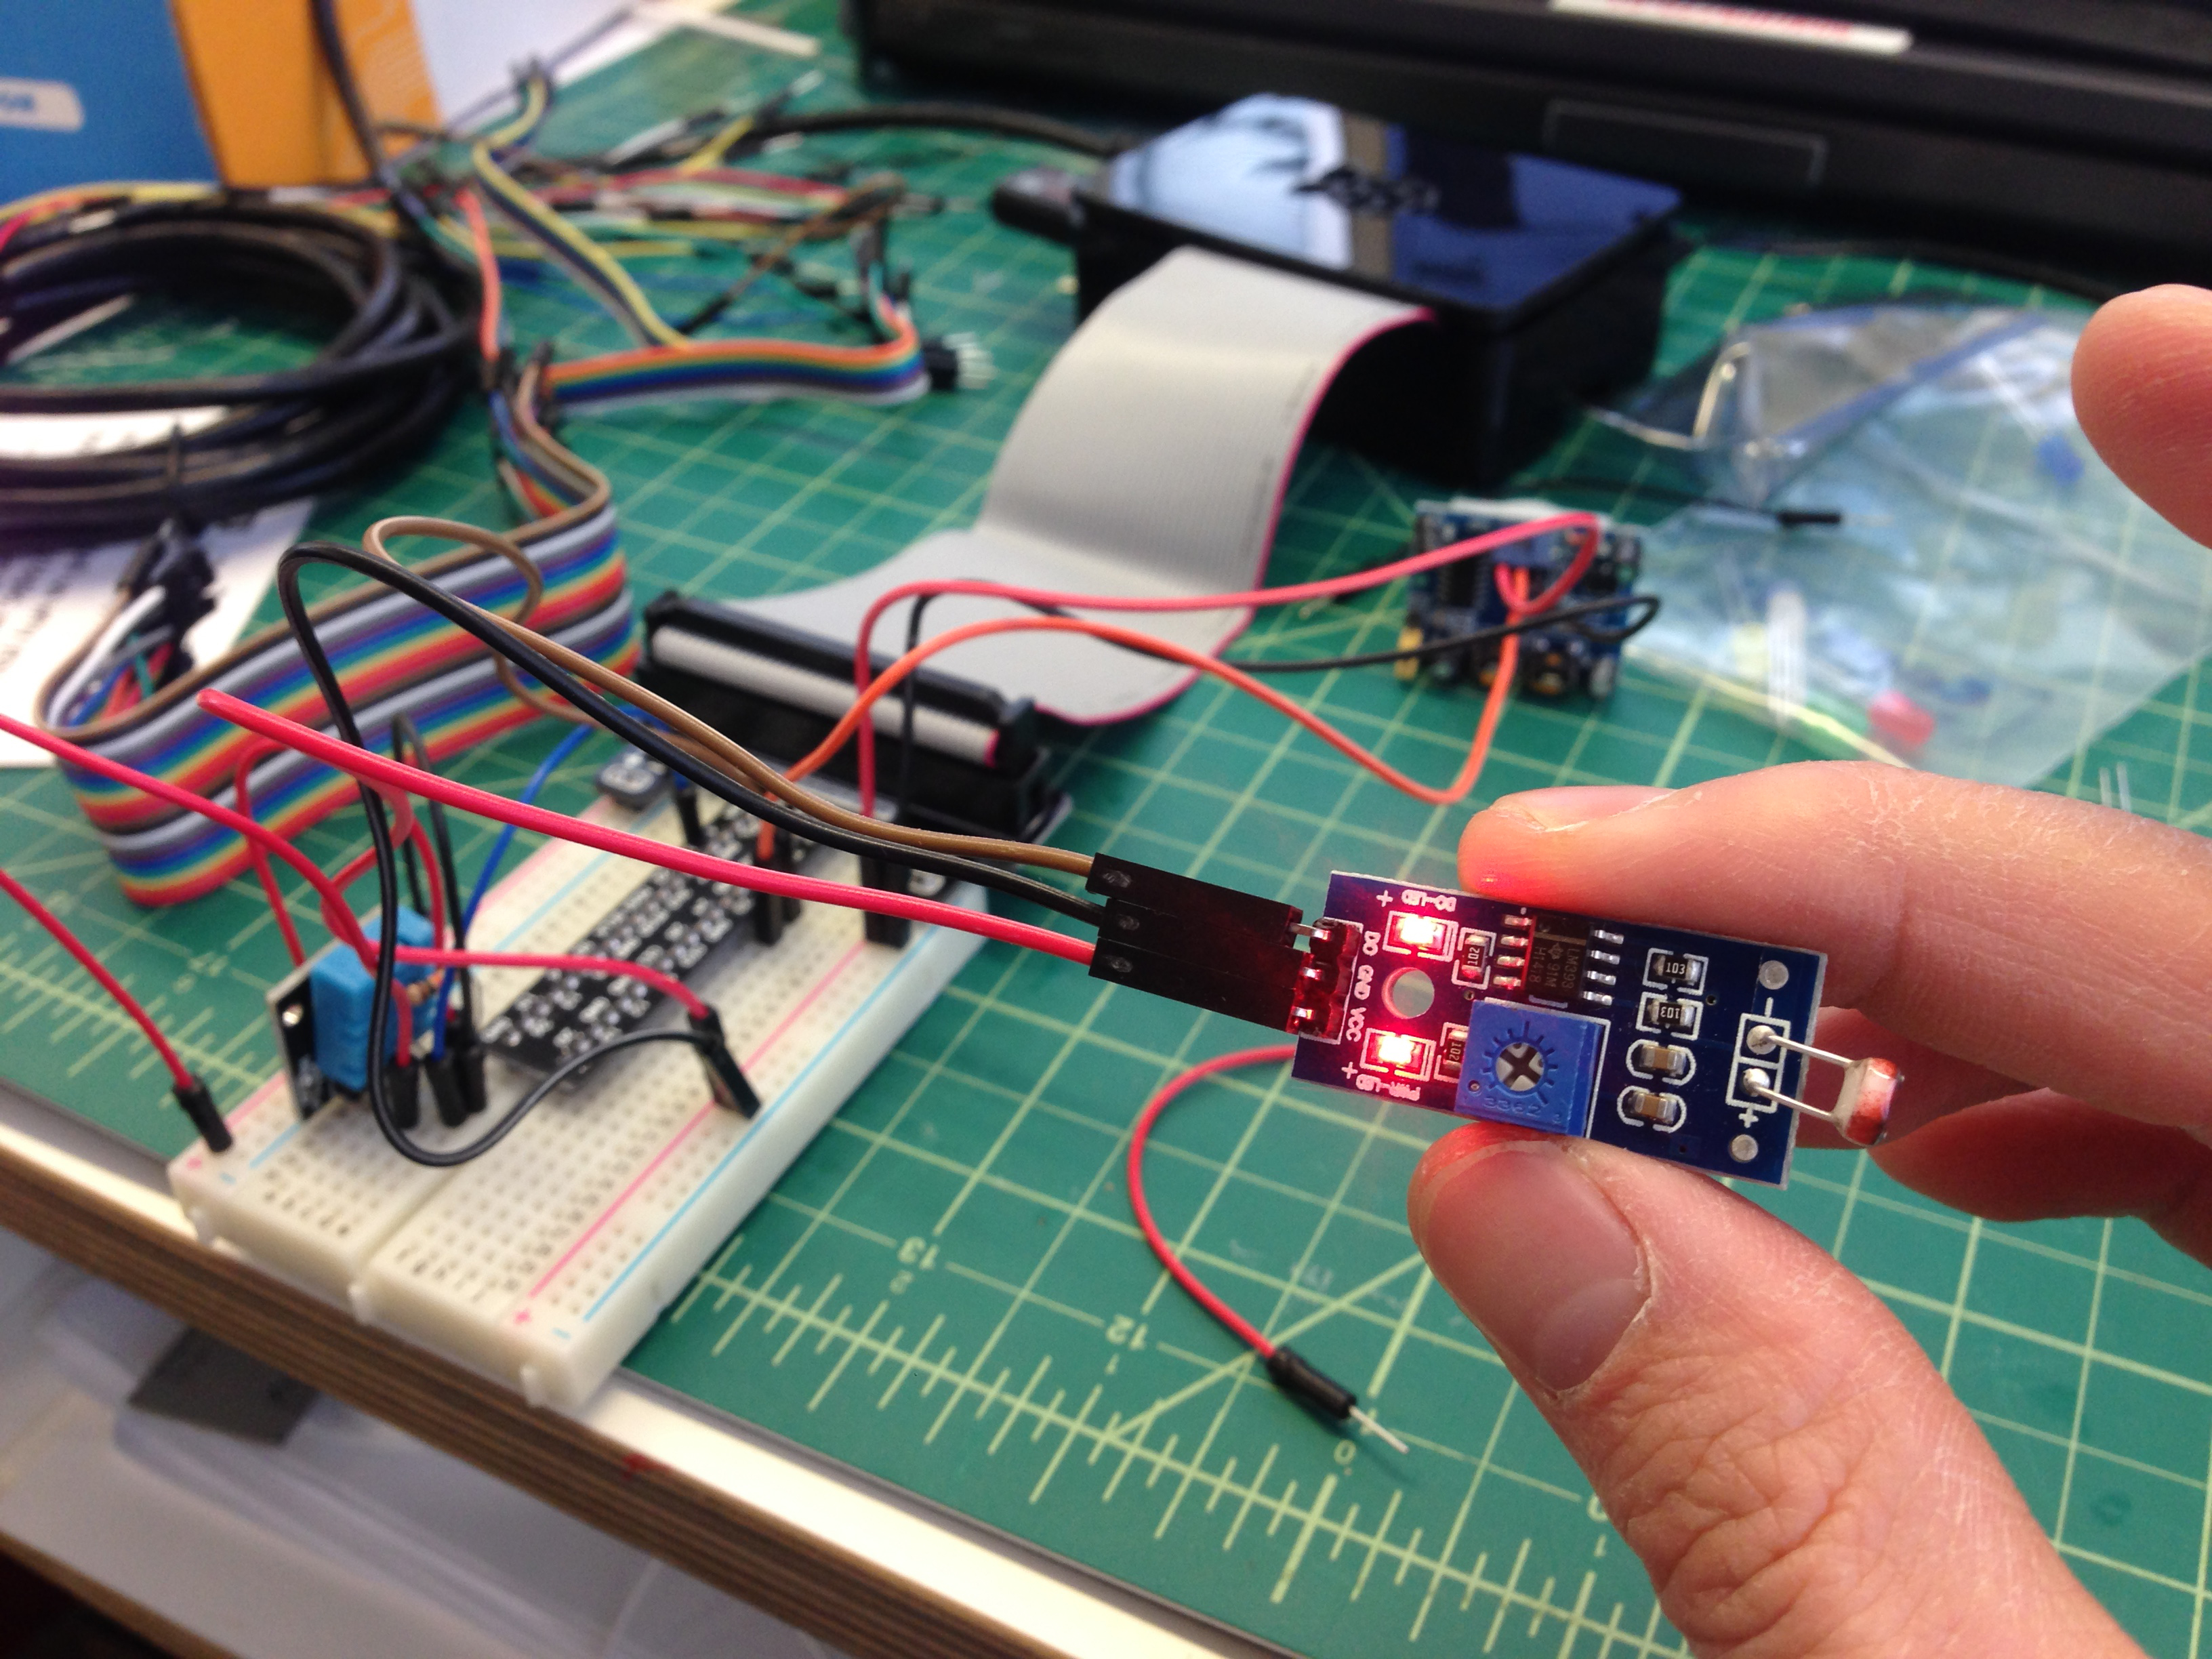
The physical computing process in Busy Bee involves real-world data collection and digital data processing. Within the studio, onboard cameras in Raspberry Pi units record human movement (OpenCV-enabled computer vision), while other sensors monitor sound, humidity and temperature (Python interpretation of GPIO input); studio workstations track file generation and associated metadata (Python scripting). Collected data is transmitted via digital cloud services (Google Sheets, Dropbox and Flux) to Grasshopper. The resulting visualization — presented in both three spatial dimensions as well as over time — offers a dynamic and interactive interface for exploring the data.
Busy Bee was implemented over six weeks as part of a half-semester course. Within the team, my focus was on sensor data collection as well as data processing and visualization creation.